Checking Sign Conventions#
The sign convention for current varies between sources of battery data. Some define “charging” as positive whereas for others charging is negative current. The SignConventionChecker class checks whether our sign choice in the battery-data-toolkit, “charging current is postive,” is followed.
[1]:
%matplotlib inline
from matplotlib import pyplot as plt
from battdat.consistency.current import SignConventionChecker
from battdat.data import BatteryDataset
from datetime import datetime, timedelta
Load Example Data#
We have two simple cells that vary only by the where the “cycle” starts.
[2]:
from battdat.io.batterydata import BDReader
dataset = BDReader().read_dataset(['../../../tests/files/batterydata/p492-13-raw.csv'])
Voltage Should Increase During Charge#
The core concept behind our sign convention is that the voltage for a battery should increase while it is charging: an principle that is true for many types of batteries.
The algorithm for checking a dataset is consistent with this principle is conceptually simple:
Find a point where the current is the most constant
Measure the slope between voltage and time.
Make sure the slope and the current have the same sign (if voltage 📈, current ➕)
There are, however, a few nuances to the actual implementation.
Step 1: Finding a Region of Stable Current#
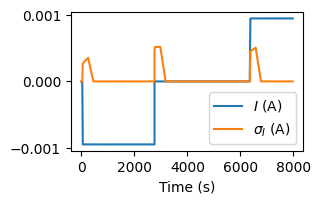
Time spans with stable current are where the standard deviation of current is small. The checker finds the most-stable region using Panda’s windowing function.
Start by converting the “test_time” column in data to a Python time object so that Pandas can compute windows corresponding to a specific time span.
[3]:
raw_data = dataset.raw_data.query('test_time < 8000').copy()  # Get a subset of the timesteries
raw_data['timestamp'] = raw_data['test_time'].apply(datetime.fromtimestamp)
A window of 6 minutes is short enough to find nearly-constant spans of current and long enough that transient fluctuations in voltage should have a minimal expect. > NOTE: The window size is an adjustable parameter in SignConventionChecker
[4]:
current_std = raw_data.rolling(timedelta(seconds=360), on='timestamp')['current'].std()
[5]:
fig, ax = plt.subplots(figsize=(3., 1.8))

ax.plot(raw_data['test_time'], raw_data['current'], label='$I$ (A)')
ax.plot(raw_data['test_time'], current_std, label='$\\sigma_I$ (A)')

ax.legend()
ax.set_xlabel('Time (s)')
[5]:
Text(0.5, 0, 'Time (s)')

There are plenty of regions of stable current in this data and some where the current is nonzero.
[6]:
window = raw_data.query('1000 < test_time < 2000')
[7]:
window
[7]:
| cycle_number | step_index | test_time | current | voltage | temperature | time | timestamp | |
|---|---|---|---|---|---|---|---|---|
| 16 | 0 | 5 | 1052.958 | -0.00095 | 3.183413 | 29.8454 | 1.578067e+09 | 1969-12-31 19:17:32.958 |
| 17 | 0 | 5 | 1252.962 | -0.00095 | 3.166171 | 29.8776 | 1.578067e+09 | 1969-12-31 19:20:52.962 |
| 18 | 0 | 5 | 1452.960 | -0.00095 | 3.148165 | 29.8937 | 1.578067e+09 | 1969-12-31 19:24:12.960 |
| 19 | 0 | 5 | 1652.958 | -0.00095 | 3.129091 | 29.8454 | 1.578067e+09 | 1969-12-31 19:27:32.958 |
| 20 | 0 | 5 | 1852.962 | -0.00095 | 3.109255 | 29.8293 | 1.578068e+09 | 1969-12-31 19:30:52.962 |
Step 2: Compute the slope between voltage and time#
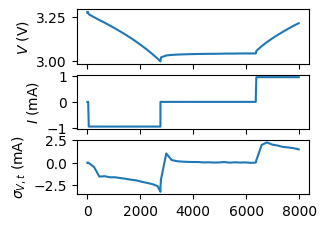
The slope between two variables is proportional to the covariance, which can also be computed for a rolling window
[8]:
cov = raw_data.rolling(timedelta(seconds=360), on='timestamp')['voltage'].cov(raw_data['test_time'])
[9]:
fig, axs = plt.subplots(3, 1, figsize=(3., 2.4), sharex=True)

axs[0].plot(raw_data['test_time'], raw_data['voltage'])
axs[0].set_ylabel('$V$ (V)')

axs[1].plot(raw_data['test_time'], raw_data['current'] * 1000)
axs[1].set_ylabel('$I$ (mA)')

axs[2].plot(raw_data['test_time'], cov)
axs[2].set_ylabel('$\\sigma_{V,t}$ (mA)')

ax.legend()
ax.set_xlabel('Time (s)')
[9]:
Text(0.5, 24.0, 'Time (s)')

Note how the covariance between voltage and time (\(\sigma_{V,t}\)) has the same sign as the current for the regions where the data are the same.
Step 3: Compare signs#
The SignConventionChecker does these two previous steps and compares the outcome
[10]:
chckr = SignConventionChecker()
chckr.check(dataset)
[10]:
[]
No errors for this dataset. ✅
If we change the sign, the checker will notice and report why the data are wrong
[11]:
dataset.raw_data['current'] *= -1
chckr.check(dataset)
[11]:
['Potential sign error in current. Average current between test_time=299170.4s and test_time=299530.4 is 9.5e-03 A and the covariance between the voltage and current is -1.5e+00 V-s. The current and this covariance should have the same sign.']
[ ]:
