Defining Complex Charge Dependence in ECMs#
Many parameters in equivalent circuit models (ECMs) depend on how charged the battery is. The most common example is that the voltage of a cell increases with the state of charge (SOC). Moirae provides several routes to expressing the SOC dependence for different properties
Interpolated SOC Dependence#
Define a complex dependence on SOC using SOCInterpolatedHealth
[1]:
from moirae.models.components.soc import SOCInterpolatedHealth
from moirae.models.ecm.utils import realistic_fake_ocv
import numpy as np
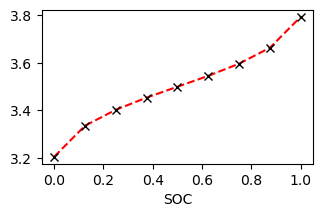
This function takes the values of the property at specific states of charge.
[2]:
soc = np.linspace(0, 1, 9)
points = realistic_fake_ocv(soc)
Supply both the value of the function (base_values) and, optionally, the points at which they are evaluated.
Moirae assumes evenly-spaced SOC points between 0 and 1 by default.
[3]:
ocv = SOCInterpolatedHealth(
    base_values=points,
    soc_pinpoints=soc,
    interpolation_style='linear',
)
[4]:
%matplotlib inline
from matplotlib import pyplot as plt
fig, ax = plt.subplots(figsize=(3.5, 2.))

# Evaluate the function
#  Always returns a 2D array. First is the batch size, last is the property
value = ocv.get_value(soc)[0, :]
ax.plot(soc, value, 'r--')
ax.plot(soc, points, 'kx')

ax.set_xlabel('SOC')
[4]:
Text(0.5, 0, 'SOC')
Interpolation with Polynomial Scaling#
Interpolation functions can capture complex function shapes, at the expense of many fitting parameters.
The ScaledSOCInterpolatedHealth keep can keep the complex shapes of interpolated functions and instead a few “scaling” parameters that describe small changes to the shape.
Use the ScaledSOCInterpolatedHealth to define SOC dependence in two layers:
base_values,soc_points: The base shape of the functional dependencescaling_coeffs: Parameters of a Legendre polynomial used to adjust the shape.
Aside: Legendre Polynomials are good for interpolation because each polynomial is orthogonal to all others)
[5]:
from moirae.models.components.soc import ScaledSOCInterpolatedHealth
The interpolated curve is unchanged if all scaling parameters are zero. The first parameter introduces the same change to all points, the second adds a linear dependence to SOC, the third a quadratic, and so on.
[6]:
ocv = ScaledSOCInterpolatedHealth(
    base_values=points,
    scaling_coeffs=[0., 0., 0.]
)
Evaluate with a few changes
[7]:
scaled_allzero = ocv.get_value(soc)[0, :]
[8]:
ocv.scaling_coeffs[0, 0] = 0.05
scaled_constant = ocv.get_value(soc)[0, :]
[9]:
ocv.scaling_coeffs[0, :2] = [0., 0.1]
scaled_linear = ocv.get_value(soc)[0, :]
[10]:
ocv.scaling_coeffs[0, 1:] = [0, 0.1]
scaled_quadra = ocv.get_value(soc)[0, :]
[11]:
fig, ax = plt.subplots(figsize=(3.5, 2.))

# Evaluate the function
#  Always returns a 3D array. First two are batch sizes, last is the property
ax.plot(soc, value, 'k--', label='Intepolated')
ax.plot(soc, scaled_allzero, 'r', label='No Scaling', alpha=0.5)
ax.plot(soc, scaled_constant, 'b', label='Constant', alpha=0.5)
ax.plot(soc, scaled_linear, color='purple', label='Linear', alpha=0.5)
ax.plot(soc, scaled_quadra, color='orange', label='Quadratic', alpha=0.5)

ax.legend(fontsize=8)
ax.set_xlabel('SOC')
[11]:
Text(0.5, 0, 'SOC')
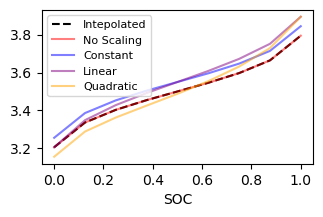
Estimators could adjust the slightly by fitting 3 ocv.scaling_coeffs instead of fitting all 9 ocv.base_values points.
Polynomial Dependence#
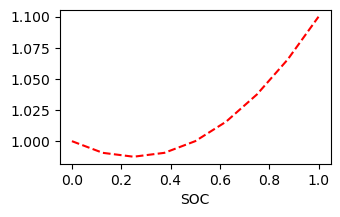
Define a simpler function as a polynomials. At present, we only support Power Series polynomials but open an Issue if you’d like another type (see NumPy’s list).
[12]:
from moirae.models.components.soc import SOCPolynomialHealth
Define the polynomial using
[13]:
r0 = SOCPolynomialHealth(
    coeffs=[1, -0.1, 0.2]  # 1 - 0.1 x + 0.2 x ^ 2
)
[14]:
fig, ax = plt.subplots(figsize=(3.5, 2.))

# Evaluate the function
#  Always returns a 2D array. First is the batch size, last is the property
value = r0.get_value(soc)[0, :]
ax.plot(soc, value, 'r--')

ax.set_xlabel('SOC')
[14]:
Text(0.5, 0, 'SOC')
Advanced: Batching and SOC Dependence#
Moirae estimators guess batches of parameter values that may include both multiple values for interpolation points and multiple values of SOC.
The output if therefore two “batch size” x “number of SOC values per batch”
[15]:
help(ocv.get_value)
Help on method get_value in module moirae.models.components.soc:

get_value(soc: Union[numbers.Number, List[float], numpy.ndarray], batch_id: int | None = None) -> numpy.ndarray method of moirae.models.components.soc.ScaledSOCInterpolatedHealth instance
    Computes value(s) at given SOC(s).

    Args:
        soc: Values at which to compute the property. Dimensions must be either

            1. a 2D array of shape `(batch_size, soc_dim)`. The `batch_size` must either be 1 or
               equal to the batch size fo the parameters.
            2. a 1D array of shape `(soc_dim,)`, in which case we will consider the `batch_size` to be equal to 1
            3. a 0D array (a scalar), in which case both `batch_size` and `soc_dim` are equal to 1.
        batch_id: Which batch member for the parameters and input SOC values to use. Default is to use whole batch
    Returns:
        Interpolated values as a 2D with dimensions (batch_size, soc_points).
        The ``batch_size`` is 0 when ``batch_id`` is not None.
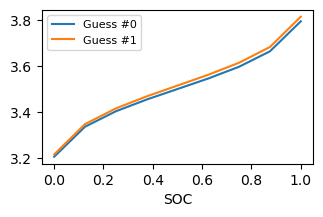
Provide multiple guesses for scaling points will affect the first point.
[16]:
ocv.scaling_coeffs = np.array([[0., 0.], [0.01, 0.01]])
[17]:
outputs = ocv.get_value(soc)
outputs.shape
[17]:
(2, 9)
The array is 2 (batch size of parameter functions) x 9 (number of SOC points in the evaluation)
[18]:
fig, ax = plt.subplots(figsize=(3.5, 2))

for i, y in enumerate(outputs[:, :]):
    ax.plot(soc, y, label=f'Guess #{i}')

ax.legend(fontsize=8)
ax.set_xlabel('SOC')
[18]:
Text(0.5, 0, 'SOC')
Each member of the output batch is with a different value of parameters
It is also possible to save execution time by only evaluating a single row of a batch
[19]:
outputs = ocv.get_value(soc, batch_id=0)
outputs.shape
[19]:
(1, 9)
[ ]: